
We compiled these trends from over 100 brands, comparing year-over-year data for the date range February 1, 2026, to February 28, 2026.
February 2026: Economic Pressures Weigh on Performance
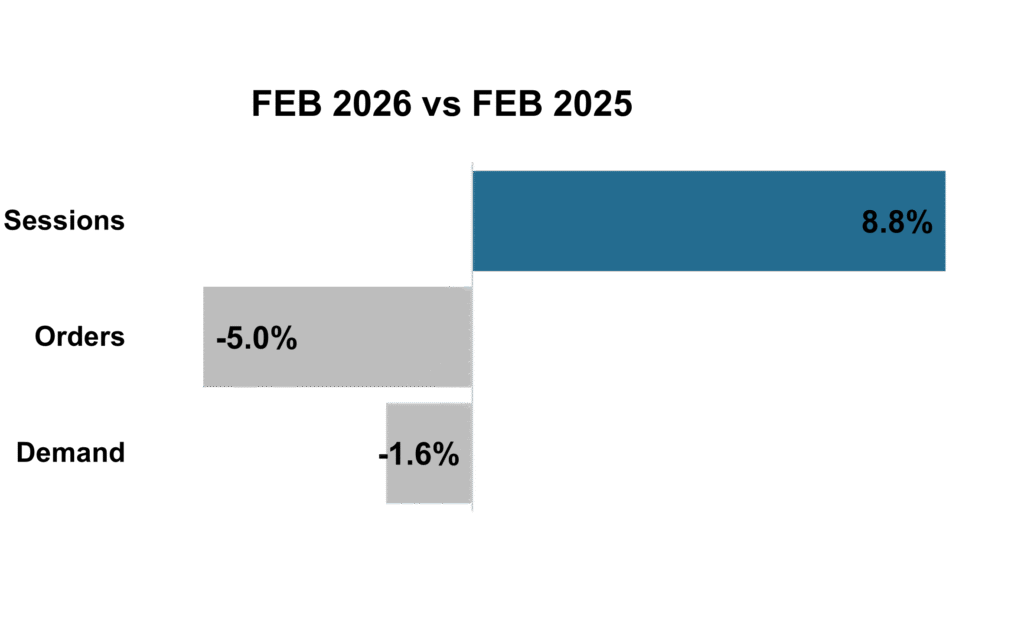
February performance showed mixed results. Sessions were up almost 9%, but weaker conversion rates led to a 5% drop in orders and a 1.6% decline in demand.
Consumer sentiment continues to be soft. Nearly half of shoppers believe economic conditions are getting worse, and inflation continues to affect budgets. Many households are shifting to lower-priced products as a result.
Uncertainty in the job market is also adding pressure. Employers cut roughly 92,000 positions in February, and unemployment rose to 4.4%. Leading to more cautious spending.
Some seasonal categories, like home improvement and gardening, performed better as customers prepared for spring.
A recent Supreme Court ruling removed broad emergency tariffs but introduced new uncertainty around future import costs. Brands that rely on global production may see short-term cost relief. However, the war in Iran poses a new challenge, disrupting energy markets and supply chains.
Despite these challenges, upside remains. The National Retail Federation (NRF) projects retail sales will grow 4.4% in 2026. In addition, early tax refund data suggests larger refunds than last year, which may provide a lift to near-term spending.
February 2026 Marketing Trends

Trend #1: Retail Outlook 2026: Strong Consumer Demand Defies Economic Uncertainty
U.S. consumers are expected to keep spending in 2026, even amid economic uncertainty. The National Retail Federation (NRF) projects 4.4% growth in 2026, which is stronger than the decade before the pandemic. Low unemployment, steady wage gains, and larger tax refunds are helping drive consumer spending.
Retail sales grew nearly 4% in 2025, reaching $5.4 trillion. Holiday sales topped $1 trillion for the first time. Retailer earnings reflect this strength. Companies across categories, including Costco, American Eagle, Macy’s, and Gap, posted solid quarterly results. Shoppers continue to look for quality and value, which has helped warehouse clubs and other value-focused brands.
At the same time, spending patterns are splitting. Higher‑income households remain comfortable and continue to buy luxury goods and premium experiences. Lower‑income consumers are more cautious and price-conscious. Younger generations are also reshaping the market. Gen Z and millennials often shift brands, prefer convenience, and spend heavily on dining and travel.
However, the NRF warns that risks remain. Inflation, potential tariffs, and especially the war in Iran could disrupt energy markets, supply chains, and consumer confidence.
Trend #2: Supreme Court Tariff Ruling: Cost Relief with New Uncertainty
What Happened
The Supreme Court ruled that the International Emergency Economic Powers Act cannot be used for broad emergency tariffs. Most duties tied to that rule are now unwinding. The administration then added a temporary global tariff under a different authority, which can last about 150 days unless extended.
Why It Matters
- Import costs may drop, but the new temporary tariff reduces the benefit. Pricing, margin plans, and promotion depth will need close monitoring.
- Refunds on past duties may be possible, but the process is not yet clear.
What To Do Now
- Form a weekly working session across sourcing, finance, and marketing.
- Plan for three possible outcomes regarding the temporary tariff. Update contribution models each month.
- Keep value messages sharp until the 150-day window becomes clear.
Trend #3: What 2026 USPS Pricing Means for Print and Parcel Strategies

USPS pricing is moving on two tracks in 2026. Print programs fall under the market‑dominant track, with rates held flat for the first half of the year. Packages and parcels sit on the competitive track, where rising rates and surcharges continue to pressure fulfillment margins.
Mailing rates for letters and flats stay stable through early 2026, with the next increase expected in July. USPS projects an average 5.3% increase for market‑dominant products.
Parcel economics are moving in the opposite direction. Costs continue to climb, and packaging choices, dimensional accuracy, and routing decisions are more important than ever.
Priorities for the next 12 to 18 months
- Remove non‑responders from circulation.
- Adjust cadence to avoid over‑mailing.
- Time in‑home delivery around key seasonal windows.
- Test formats and creative where it fits.
Bottom line: Lower costs in the first half of 2026 give brands a great opportunity to grow with print.
Jump to Section
Marketing KPIs: February 2026 Trends by Industry
Marketing KPIs: February 2026 Trends by Company Revenue
$100M+ | $15M-$100M | $0-$15M
Marketing KPIs: February 2026 Trends by Industry
Apparel Brands
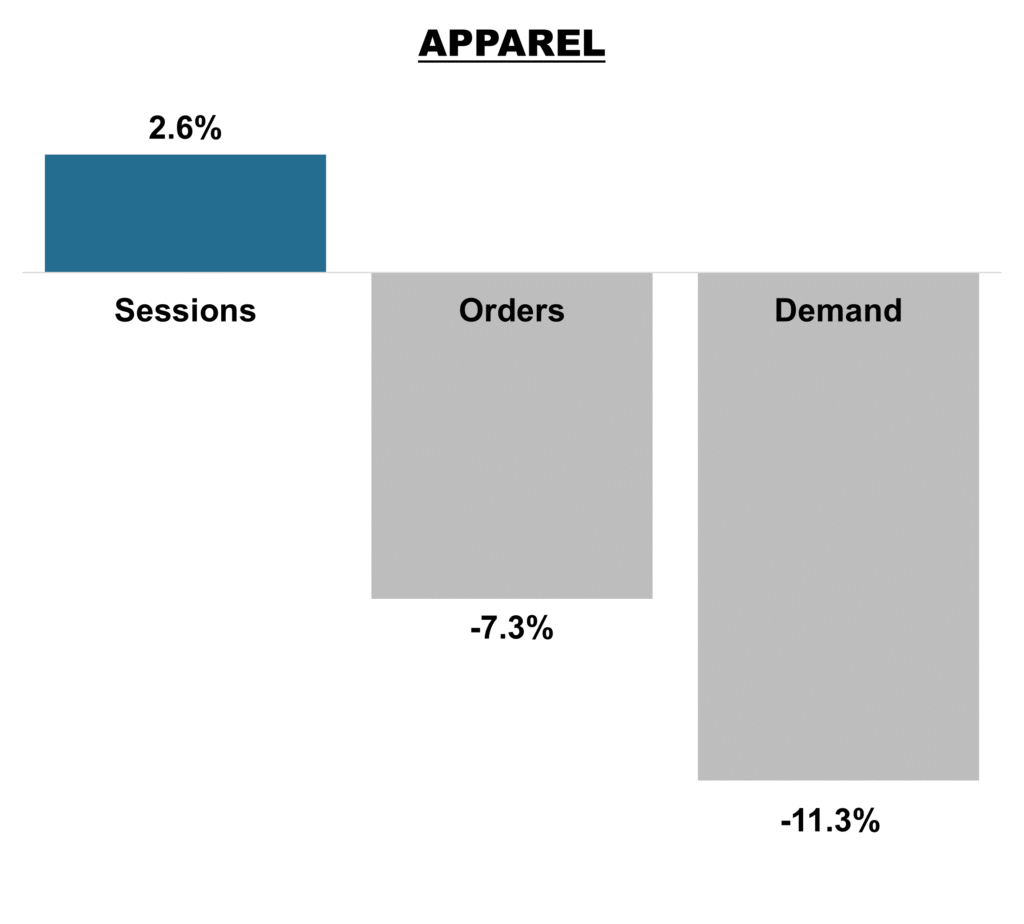
In February, sessions increased 2.6% year over year, but orders declined -7.3%. Customers visited more often, but fewer converted, and those that did spent less. Revenue fell -11.3%, outpacing the drop in orders and highlighting pressure on average order values.
Home Brands
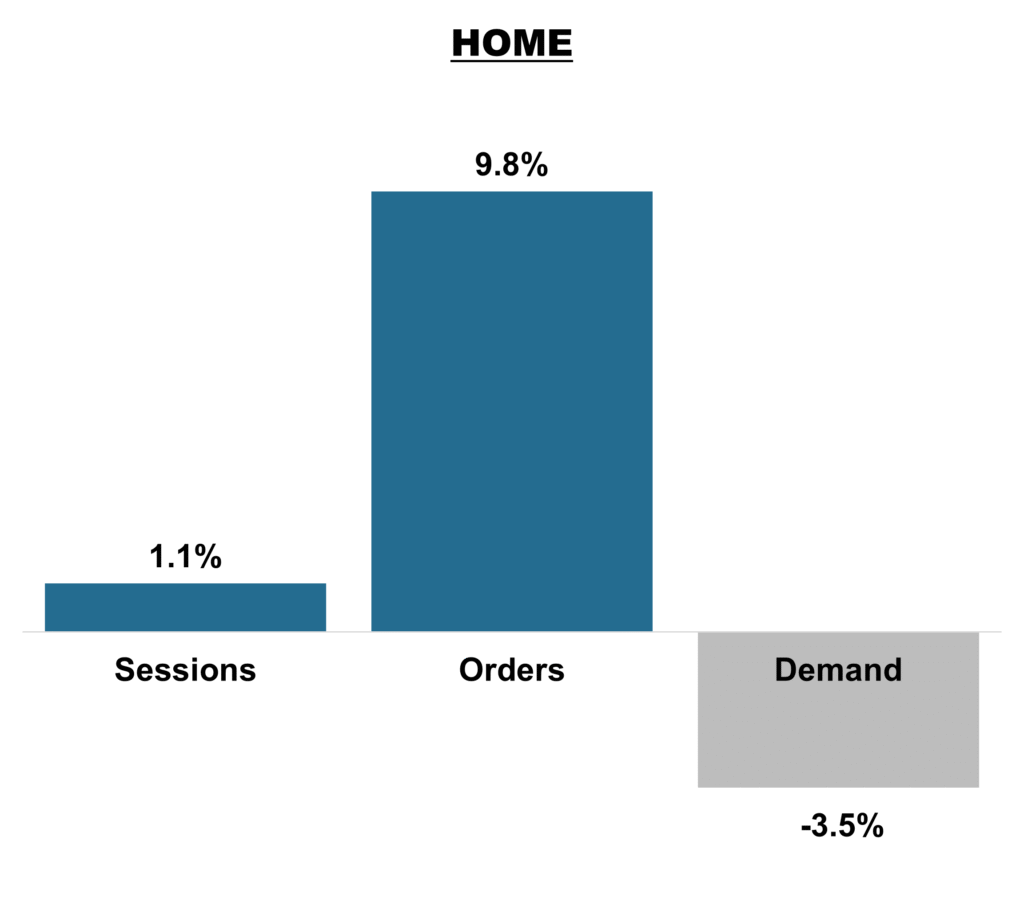
Sessions increased 1.1% year over year, while orders rose 9.8%, signaling a notable improvement in conversion for home brands. However, revenue declined 3.5%, as promotional activity and lower-priced purchases weighed on demand.
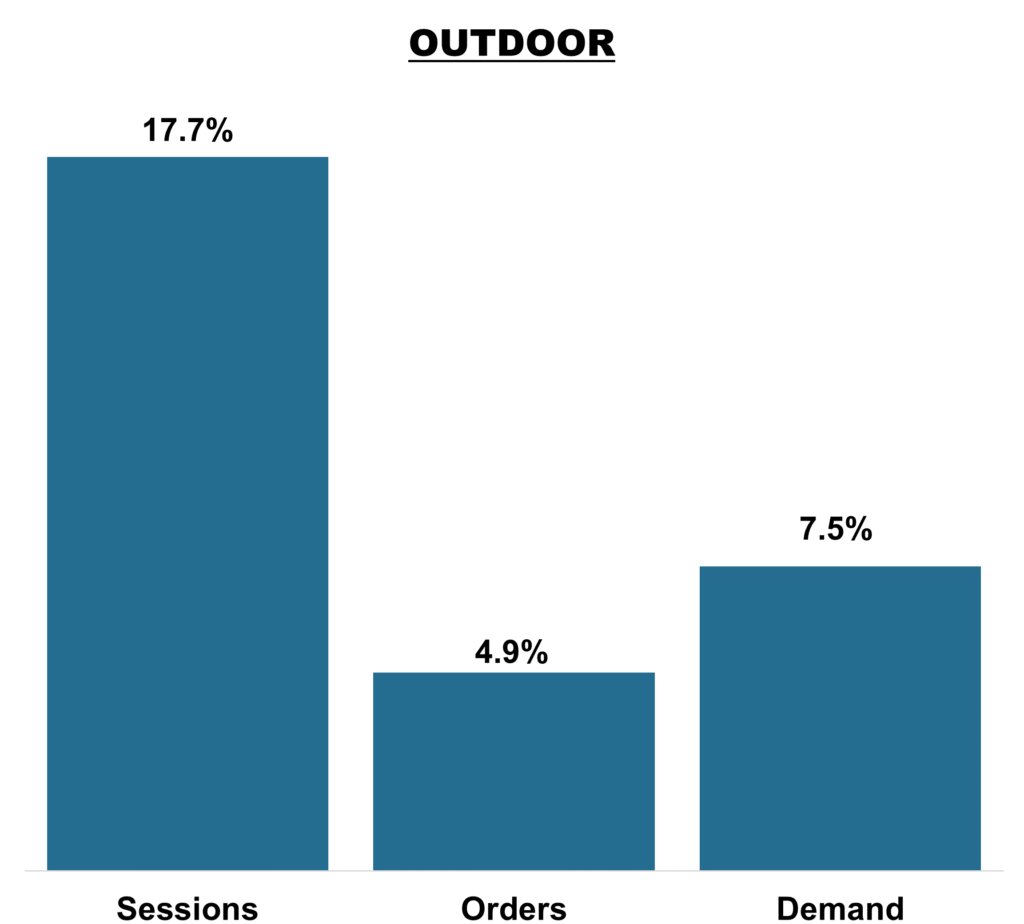
Outdoor Brands
Sessions increased 17.7% year over year, reflecting strong top‑of‑funnel momentum for outdoor retailers. Orders rose 4.9%, trailing traffic and signaling weaker conversion versus last year. However, revenue grew 7.5%, with modest improvements in average order values.
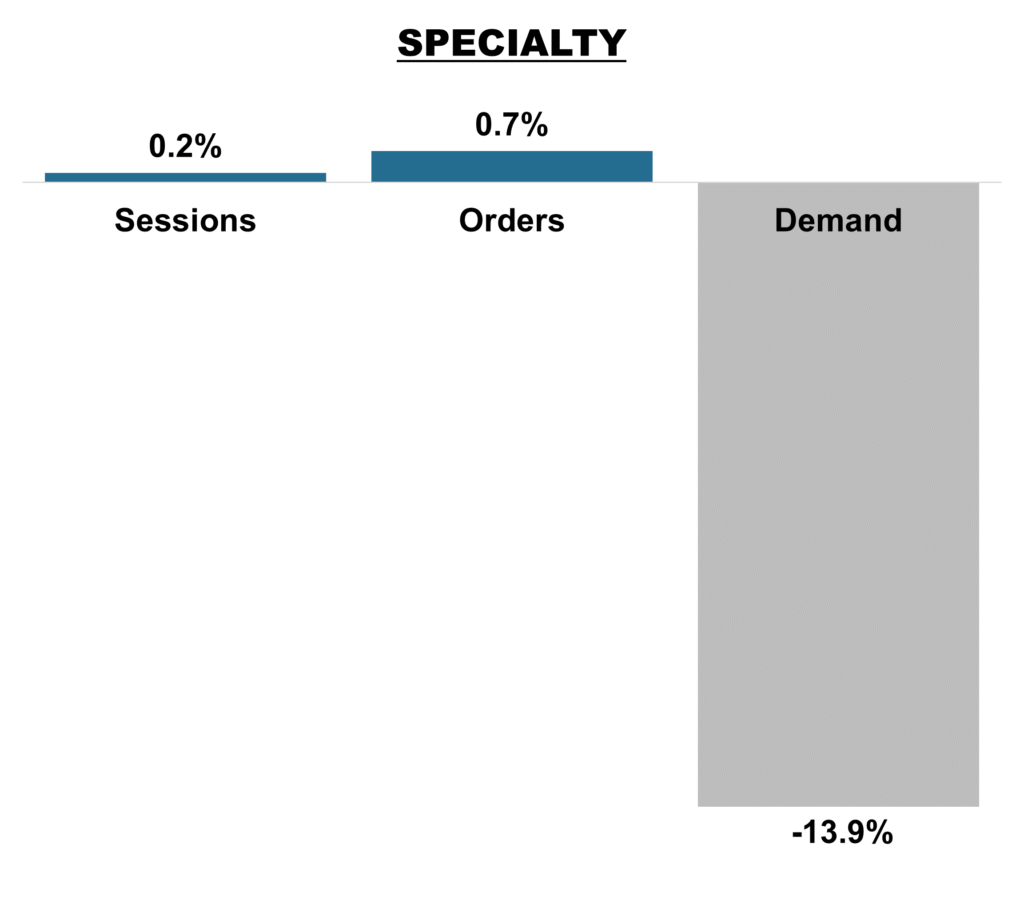
Specialty Brands
Sessions increased 0.2% year over year, and orders rose 0.7%, indicating a slight improvement in conversion. Revenue declined 13.9%. Customers engaged with the category, but the mix shifted toward lower-priced products. For specialty brands, the main priority in the coming months will be protecting average order values.
Marketing KPIs: February 2026 Trends by Company Revenue
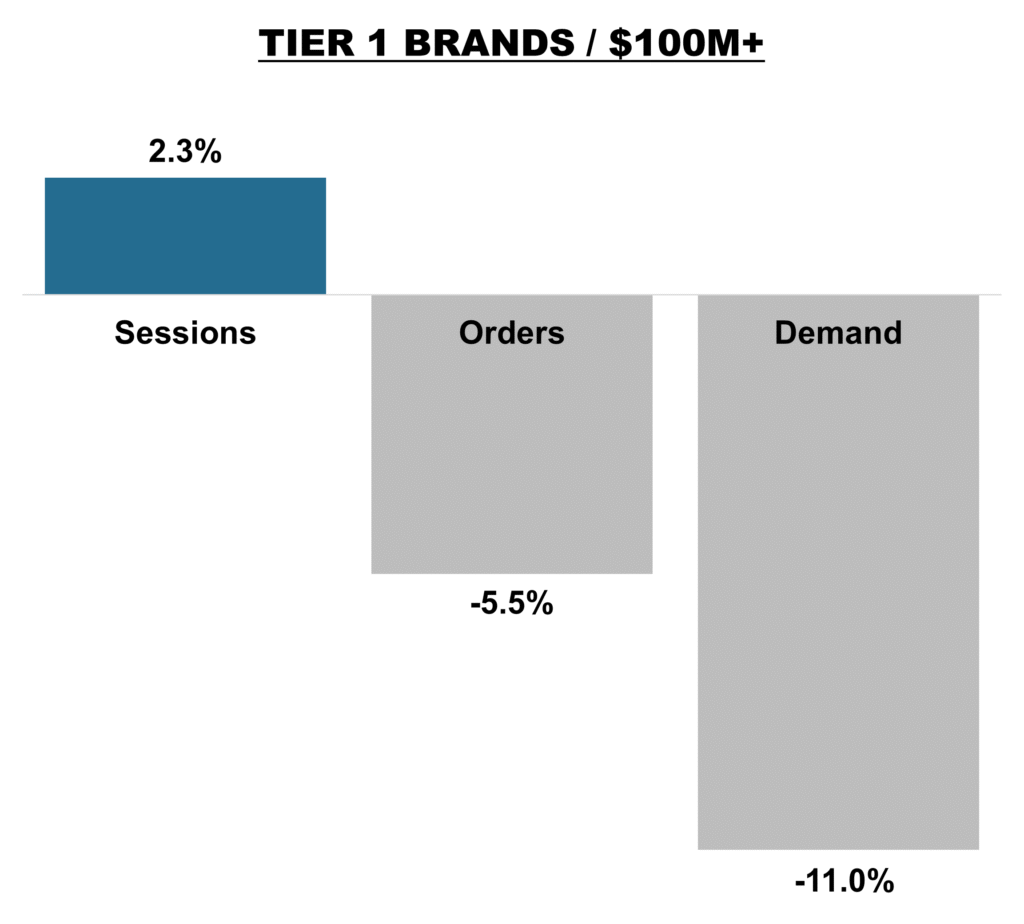
Tier 1 Brands
Sessions increased 2.3% year over year, but orders declined -5.5%, indicating weaker conversion efficiency versus last year. Revenue fell -11.0%. These brands are seeing more visits, but weaker conversion and smaller baskets tied to sharper price sensitivity.
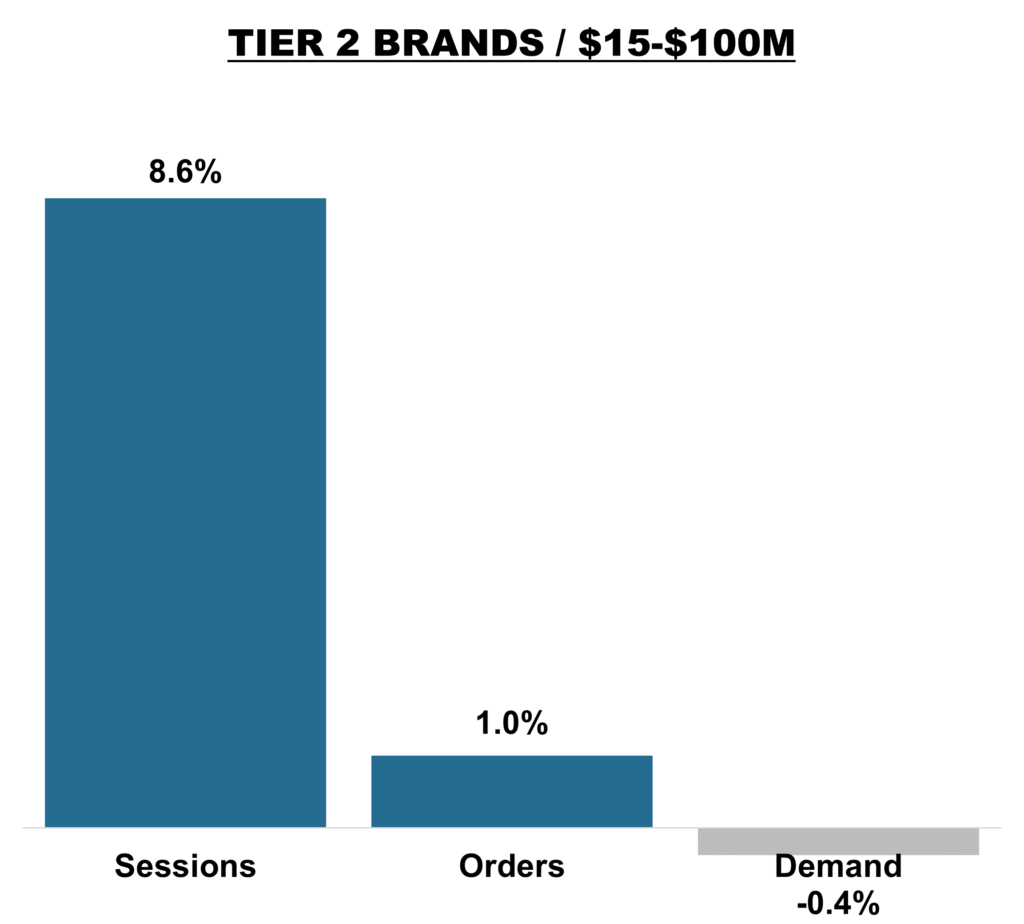
Tier 2 Brands
Sessions increased 8.6% year over year, reflecting strong top‑of‑funnel momentum. Orders rose 1.0%, trailing traffic and signaling softer conversion. Revenue declined -0.4%. Traffic is strong. However, monetization is not keeping pace, as customers compare more and spend more cautiously.
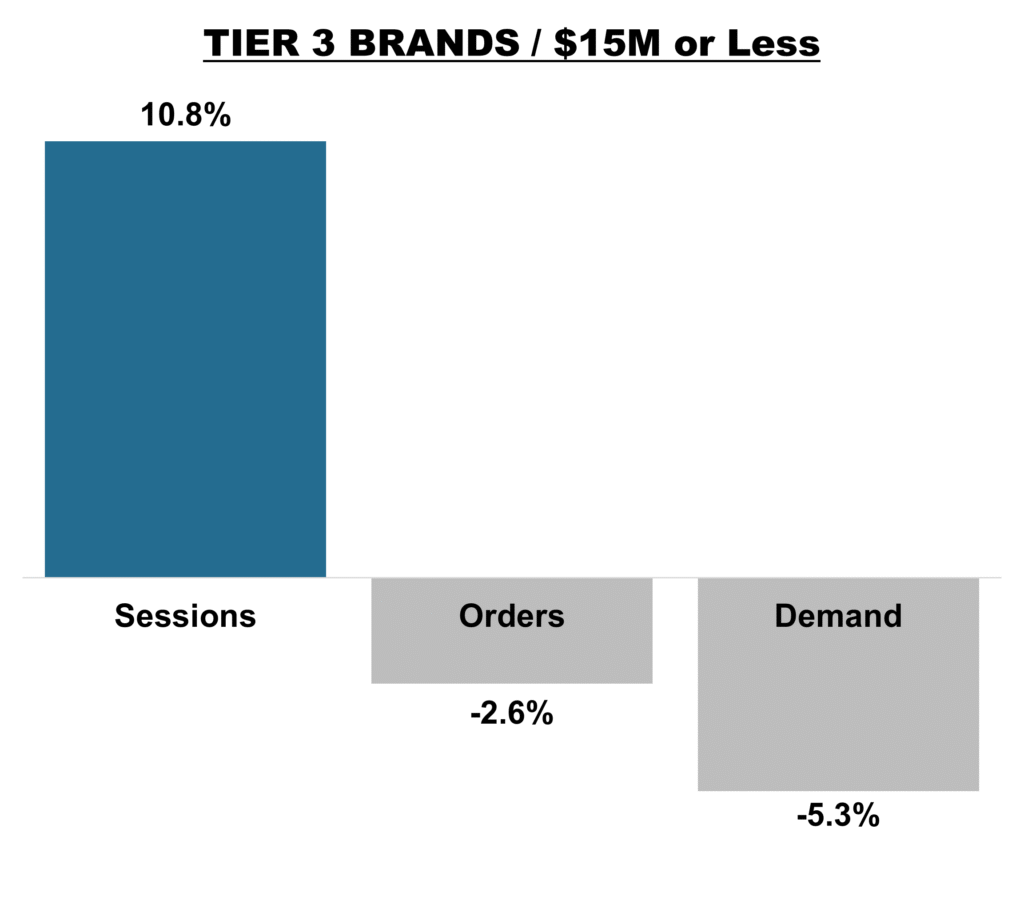
Tier 3 Brands
Sessions increased 10.8% year over year for Tier 3 brands, but orders declined -2.6%, indicating a notable drop in conversion efficiency. Revenue fell -5.3%, outpacing the decline in orders and pointing to compression in average order values and mix. Customers are browsing, but brands are unable to convert that attention.
In the News

Brand Associations
While traveling in Salzburg, Austria, our president, Brent Niemuth, shares an important observation. What is your brand associated with? And are they the right things?

How Hospitality Brands Can Stand Out
Today’s travelers expect more than just comfort—they want memorable, meaningful experiences. Learn how hospitality brands are adapting with stronger storytelling, personalization, and values-driven strategies to win long-term loyalty.
Read More →

World’s Most Sustainable Synthetic Paper
MIDLAND’s Digital Edge Environmental Polyester is the logical choice for printers and end users alike who wish to excel in their sustainability efforts while minimizing their environmental impact.
Read More →

Build a Brand That Truly Connects
Your brand is more than a logo—it’s the emotional connection you create with customers. See how we help companies uncover their unique voice and turn it into a powerful, consistent brand experience.
Read More →
GET IN TOUCH
Questions? Need help integrating online and offline channels?
Tags: February 2026 Marketing Benchmarks, February 2026 Marketing KPIs, marketing, Strategy